Methodology
Each dollar is assigned randomly to a candidate according to a weighted die. Each donor will therefore see different numbers, but on average, across all donors, the amounts will be distributed according to these weights.
Weights are computed as the expected increase in win probability due to each dollar. A dollar has the biggest effect on neck-and-neck races. If a candidate is almost certainly going to win lose, a dollar has very little effect. In between those extremes, the effect of a dollar is intermediate.
This diagram shows these relationships, using outputs from FiveThirtyEight’s 2020 Senate model:
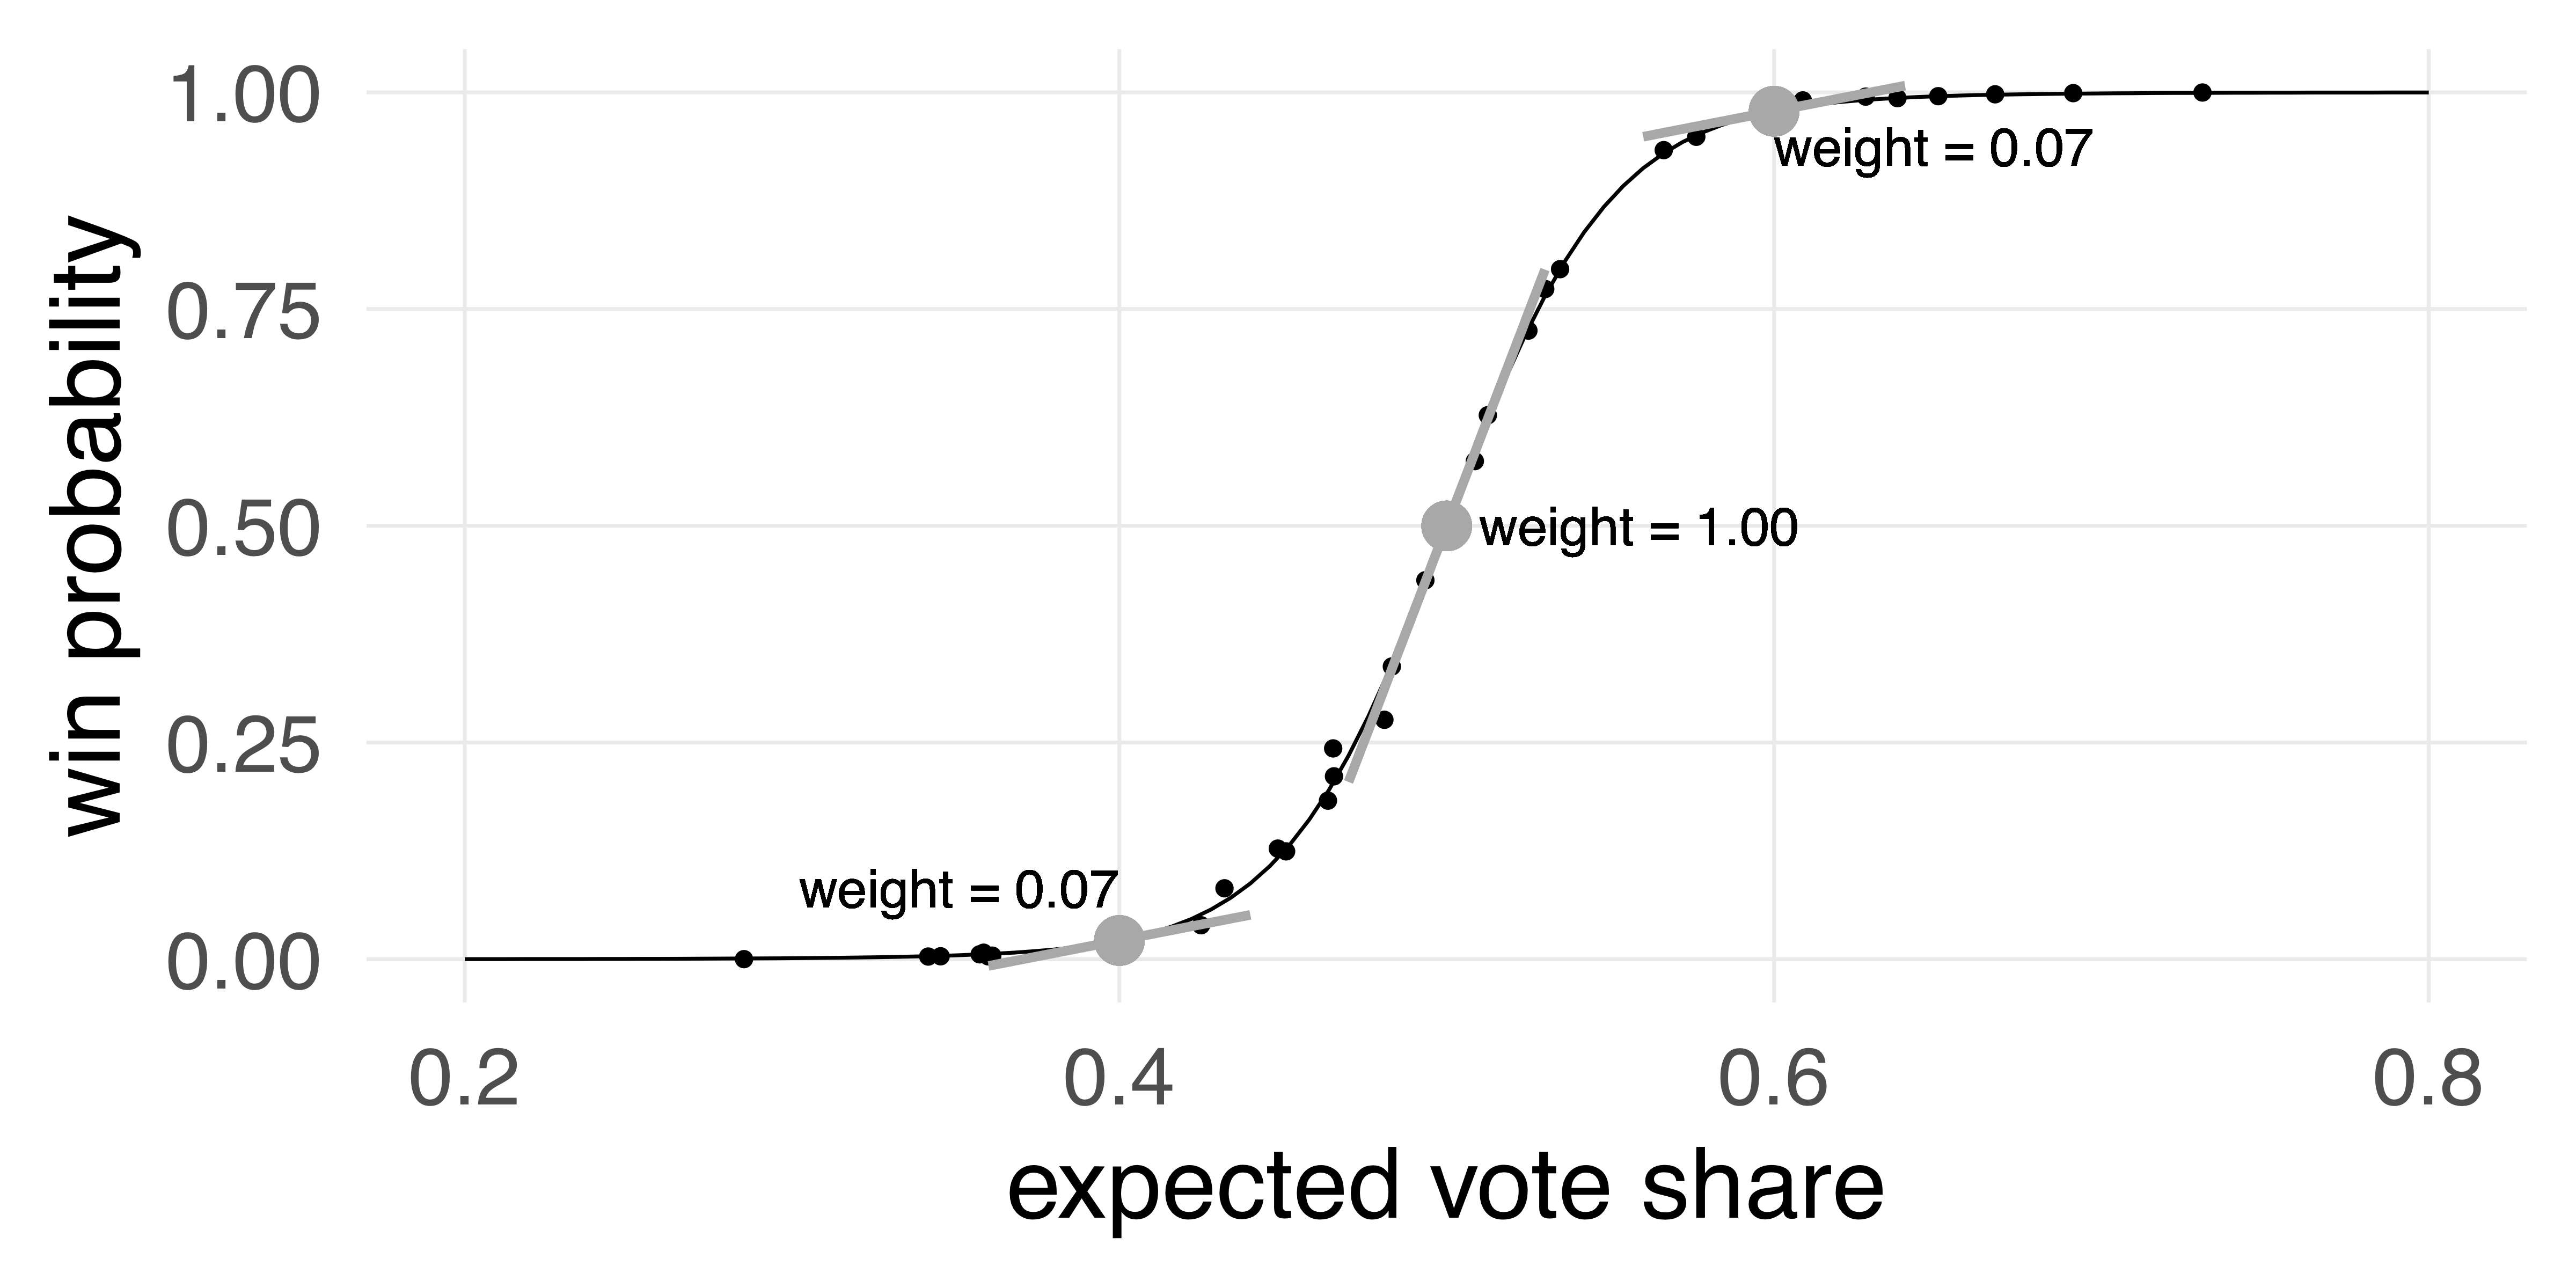
The x axis represents expected vote share based on polling so far, and the y axis represents win probability. The little black dots are the numbers from FiveThirtyEight’s model, and the black curve was fitted to those dots. For a candidate with a 50% chance (the gray dot right in the middle of the diagram), the slope of the curve (illustrated using the gray line segment through that dot) tells you how win probability changes with vote share. If you assume that dollars have a linear effect on expected vote share, then the slope of that curve tells you how much effect a dollar will have on increasing the probability of winning, and we use that as a weight.
For a 50/50 race, we set the weight to 1.
For a Democratic candidate with a current expected vote share of 40%, the probability of winning is very low, and the slope of the curve is much smaller—giving money to that candidate won’t help much. The slope—and the weight—is only 0.07, relative to the 50/50 race.
And for a candidate likely to win, with an expected vote share of 60%, money is also not very helpful: the weight is the same as the candidate likely to lose, 0.07.
In short, to compute weights, I do the following each day:
- Download FiveThirtyEight’s win probabilities and vote shares for each race.
- Fit a curve to the relationship between vote share and win probability. The curve is the cumulative distribution function of a t distribution, with the degrees of freedom fitted to the data.
- Compute weights as the slope of that curve at the point corresponding to each candidate, scaled relative to a 50/50 race, which is given a weight of 1.
Weights are based on two simplifying assumptions: (1) that probabilities can be mapped approximately to vote share, and (2) that the effect of a dollar on vote share is approximately constant across races. This is not a perfect model, but it does on the whole give more money to races that are more likely to be crucial without completely ignoring candidates with, e.g., a 10% or 90% chance of winning.
Before FiveThirtyEight’s models were running this year, Senate weights were based on a model by Cory McCartan, a graduate student in statistics at Harvard, and House weights were based on ratings from the Cook Political Report.
The website is implemented in Elm with vanilla HTML, CSS, and JavaScript, and generated using an ad-hoc mess of Python, R, and Makefiles. There is no backend. There are no tracking scripts.